Database Setup
With the cluster healthy, an application database was created through HAProxy on port 5000, which means it was created on whichever node was the primary at the time. Nothing here connects to a node directly, which is the habit worth forming: if you can only reach the database through the load balancer, you cannot accidentally write to a replica.
The schema
CREATE TABLE IF NOT EXISTS customers (
    id          SERIAL PRIMARY KEY,
    name        VARCHAR(100) NOT NULL,
    email       VARCHAR(150) NOT NULL UNIQUE,
    created_at  TIMESTAMPTZ DEFAULT now()
);

CREATE TABLE IF NOT EXISTS orders (
    id          SERIAL PRIMARY KEY,
    customer_id INTEGER NOT NULL REFERENCES customers(id),
    amount      NUMERIC(10,2) NOT NULL,
    status      VARCHAR(20) NOT NULL DEFAULT 'pending',
    created_at  TIMESTAMPTZ DEFAULT now()
);

CREATE TABLE IF NOT EXISTS ha_test (
    id          SERIAL PRIMARY KEY,
    message     TEXT NOT NULL,
    created_at  TIMESTAMPTZ DEFAULT now()
);
The ha_test table exists only for the test. Each row is a marker recording when it was written relative to the failover, which is how the data was proved to have survived.
The sample data
INSERT INTO customers (name, email) VALUES
    ('Alice Johnson',   'alice@example.com'),
    ('Bob Smith',       'bob@example.com'),
    ('Charlie Brown',   'charlie@example.com'),
    ('Diana Prince',    'diana@example.com'),
    ('Edward Norton',   'edward@example.com')
ON CONFLICT (email) DO NOTHING;

INSERT INTO orders (customer_id, amount, status) VALUES
    (1, 150.00, 'completed'),
    (1,  75.50, 'shipped'),
    (2, 200.00, 'completed'),
    (3,  45.99, 'pending'),
    (4, 320.00, 'completed'),
    (4,  89.99, 'shipped'),
    (5, 110.00, 'pending')
ON CONFLICT DO NOTHING;

INSERT INTO ha_test (message) VALUES
    ('record-created-before-failover-1'),
    ('record-created-before-failover-2'),
    ('record-created-before-failover-3')
ON CONFLICT DO NOTHING;
That gives five customers, seven orders and three marker rows, which are the counts quoted throughout the rest of this document. The conflict clauses make the script safe to run twice.
Checking which node you reached
SELECT inet_server_addr() AS server_addr,
       inet_server_port() AS server_port,
       current_database() AS database,
       current_user      AS user,
       pg_is_in_recovery() AS is_replica,
       pg_current_wal_lsn() AS current_lsn;
This is the single most useful query in the whole lab. Because HAProxy forwards the connection, the client has no idea which node answered, and this query asks the server itself. The pg_is_in_recovery column returning false proves you are on the primary. Run the same query against port 5001 and it returns true, because that endpoint serves replicas.
Note that pg_current_wal_lsn only works on a primary. On a replica you need pg_last_wal_replay_lsn instead, which is a small detail that trips people up when they point a monitoring query at the read endpoint.
Connecting through HAProxy confirmed which node the connection had reached:
   server   | is_replica |  db
------------+------------+-------
 172.18.0.3 | f          | appdb
(1 row)
The false value in the replica column confirms the connection landed on the primary. The address is the container address of pg-node-2 on the Docker network at that time. Container addresses are assigned by Docker and will differ on your machine, so treat them as evidence from this run rather than as fixed values.
The three container addresses in this run were 172.18.0.3 for pg-node-2, 172.18.0.4 for pg-node-3 and 172.18.0.5 for pg-node-1. They are worth noting because they appear again in the replication output and after the failover, and they are how you can tell from the captured evidence which node a connection actually reached.
The row counts at this point:
SELECT 'customers' AS tbl, count(*) FROM customers
UNION ALL SELECT 'orders',  count(*) FROM orders
UNION ALL SELECT 'ha_test', count(*) FROM ha_test;
Result:
    tbl    | count
-----------+-------
 customers |     5
 orders    |     7
 ha_test   |     3
(3 rows)
Replication Validation
Replication was checked on the primary before anything was broken.
SELECT pid, application_name, client_addr, state, sync_state,
       sent_lsn, write_lsn, flush_lsn, replay_lsn
FROM pg_stat_replication;
This view exists only on the primary. Query it on a replica and you get zero rows, which is itself a quick way to tell the two apart. Each row is one connected replica, and the four position columns are how far that replica has got: what the primary has sent, what the replica has written, what it has flushed to disk, and what it has actually applied.
This is the output:
Both replicas are streaming, both are asynchronous, and all four log positions are identical across both rows. Identical positions mean the replicas have received, written, flushed and applied everything the primary has produced. The replication lag is zero.
 pid | application_name | client_addr |   state   | sync_state | sent_lsn  | write_lsn | flush_lsn | replay_lsn
-----+------------------+-------------+-----------+------------+-----------+-----------+-----------+------------
  75 | pg-node-1        | 172.18.0.5  | streaming | async      | 0/4484770 | 0/4484770 | 0/4484770 | 0/4484770
  76 | pg-node-3        | 172.18.0.4  | streaming | async      | 0/4484770 | 0/4484770 | 0/4484770 | 0/4484770
(2 rows)
Each replica was then queried directly rather than through HAProxy, bypassing the load balancer so there is no doubt which node answered. The captured result records the role and the row count together, so the query was equivalent to this, although this exact statement is a reconstruction rather than a line from one of the scripts:
SELECT pg_is_in_recovery(), count(*) AS ha_test_count FROM ha_test;Result:
pg-node-1: pg_is_in_recovery = t, ha_test_count = 3
pg-node-3: pg_is_in_recovery = t, ha_test_count = 3
Both report that they are in recovery, which is how a replica describes itself, and both hold all three marker rows that were inserted on the primary. This is the baseline the rest of the test is measured against.
How the Failover Was Tested
The approach. Rather than simulating a failure or asking Patroni to hand over cleanly, the primary container was stopped. Stopping the container sends a termination signal first and then kills the process if it has not exited. From the point of view of the surviving nodes, the primary simply disappeared and stopped renewing its lock. This is closer to a real crash than a planned switchover, and it is the harder case, because nothing gets a chance to hand over gracefully.
Which node was stopped. The primary was identified from Patroni rather than assumed. At that point the leader was pg-node-2, so pg-node-2 was the container that was stopped.
When. The container was stopped at 14:51:58 UTC.
What was recorded. Before the failover, a full snapshot of the cluster was captured to files: the container status, the Patroni cluster list, the etcd health, the replication view, the row counts and sample rows, and the logs of all five containers. The same set was captured after the failover and again after recovery. The timeline in the next section is built from those captured container logs, not from memory.
What was checked afterwards. Four things. Whether a new primary appeared without help. Whether HAProxy followed it on the unchanged connection string. Whether all the data written before the failover was still present. Whether the new primary would accept a new write.
Three separate failure cases were run, in this order: the primary was stopped, then the old primary was restarted to see whether it could rejoin, then a replica was stopped and restarted to confirm that losing a replica behaves differently from losing a primary.
The scripts that perform the failover test, capture the state and run the recovery are in the repository.
Failover Event Timeline
Every line below is taken from the container logs in test-results/failover-events, except the first, which is from the command output. Times are UTC, to the millisecond where the log provides it.
| Time | Component | Event | Source |
| 14:51:43.327 | Patroni on pg-node-2 | Last recorded lock renewal by the leader before the snapshot was taken | Log |
| 14:51:58 | Docker | The primary container pg-node-2 was stopped | Command output, not a log |
| 14:52:03.969 | Patroni on pg-node-1 | Still following pg-node-2 as leader | Log |
| 14:52:13.879 | Patroni on pg-node-1 | Still following pg-node-2 | Log |
| 14:52:23.837 | Patroni on pg-node-1 | Queried pg-node-3 and got back a state showing the cluster had no valid leader lock | Log |
| 14:52:31.829 | Patroni on pg-node-1 | Could no longer resolve the old primary’s hostname | Log |
| 14:52:31.928 | Patroni on pg-node-1 | Reported that it could not open a hardware watchdog device | Log |
| 14:52:31.929 | Patroni on pg-node-3 | Tried for the lock and lost | Log |
| 14:52:31.950 | Patroni on pg-node-3 | Followed the new leader after failing to obtain the lock | Log |
| 14:52:31.951 | Patroni on pg-node-3 | Recorded that the lock owner was now pg-node-1 | Log |
| 14:52:31.980 | Patroni on pg-node-1 | Promoted itself to leader by acquiring the session lock | Log |
| 14:52:32.087 | Patroni on pg-node-1 | Updated the leader lock during promotion | Log |
| Not timestamped | PostgreSQL on pg-node-1 | Reported the server promoting | Log, written without a timestamp |
| 14:52:36.416 | Patroni on pg-node-3 | Recorded the new primary timeline as 2, with the history branching at 0/4489F20 | Log |
| No timestamp | HAProxy | Marked pg-node-2 down in the primary pool, by connection timeout after 3003 ms | Log, no timestamps available |
| No timestamp | HAProxy | Marked pg-node-1 up in the primary pool, health check passed with code 200 in 8 ms | Log, no timestamps available |
| No timestamp | HAProxy | Marked pg-node-1 down in the replica pool, code 503 in 11 ms, which is correct because it is now the primary | Log, no timestamps available |
Two things in that timeline are worth pausing on.
The log lines at 14:52:03 and 14:52:13 show pg-node-1 still calmly following a primary that had already been dead for several seconds. Nothing is wrong there. The replicas cannot tell the difference between a primary that is dead and a primary that is briefly slow, so they wait for the lock in etcd to expire and let the timeout make the decision.
The timing of the expiry is worth working through, because it is not thirty seconds after the container stopped. The lock lives for thirty seconds from its last renewal, not from the moment of failure. The captured leader log shows renewals every ten seconds, the last visible one at 14:51:43.327, so the next would have been around 14:51:53. The container stopped at 14:51:58, five seconds after that renewal, which left the lock valid until about 14:52:23. That matches the log exactly: at 14:52:23.837 node 1 saw a state reporting the cluster as unlocked.
The practical consequence is that the delay before an election is not fixed. It varies between the loop interval and the full timeout, depending on where in the renewal cycle the failure happens. A primary that dies immediately after renewing costs you the full thirty seconds. One that dies just before a renewal was due costs you closer to twenty.
Failover Timing and Tuning
| Measurement | Value | How it is known |
| Primary stopped | 14:51:58 | Command output |
| Leader lock seen as expired | 14:52:23.837 | Log |
| New leader lock acquired | 14:52:31.980 | Log |
| Time to a new primary | About 34 seconds | Difference of the two above |
| HAProxy routing to the new primary | Within about 3 seconds of promotion | Derived from the check interval, not measured |
| Total time to working writes | About 36 to 37 seconds | Derived |
The first figure and the last are the two soft ones. The stop time came from the terminal rather than a log, and the HAProxy delay is inferred from its three second check interval, because the captured HAProxy log carries no timestamps. The middle figures are exact.
Where the time actually went
Breaking the total down matters, because only part of it can be tuned.
| Phase | Measured here | What controls it |
| Waiting for the leader lock to expire | About 25 seconds, being 30 seconds from the last renewal | The lock timeout. This is the bulk of it. |
| Surviving nodes noticing, then acting on the next loop pass | About 8 seconds | How often the Patroni loop runs |
| Promoting the winner | Around 100 milliseconds | Database size and how much log there is to replay |
| HAProxy noticing the change | Up to 3 seconds | The health check interval |
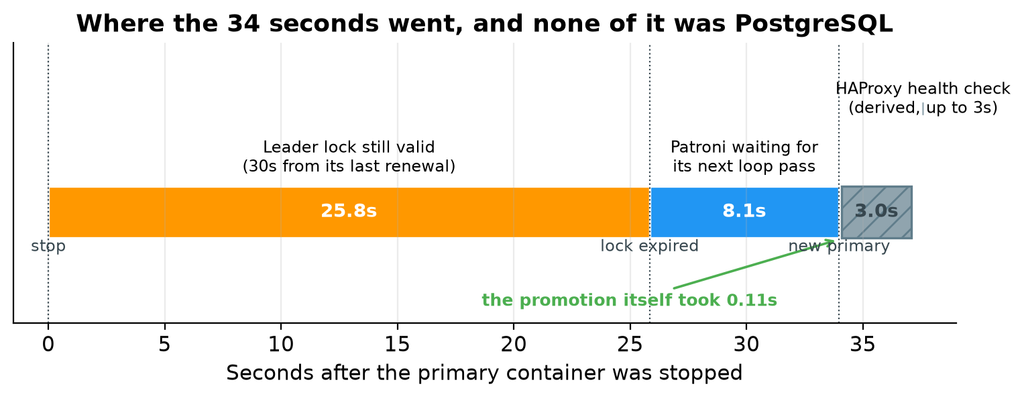
The hatched block on the right is the HAProxy check, drawn differently because it is the one segment that was not measured. The captured HAProxy log has no timestamps, so its width comes from the configured three second interval.
Around ninety percent of the outage was the cluster deliberately waiting, and none of it was PostgreSQL being slow. The promotion itself took about a tenth of a second, from acquiring the session lock at 14:52:31.980 to the leader lock being updated at 14:52:32.087. The cluster was waiting to be sure the primary was really gone.
The eight second gap between noticing at 14:52:23.837 and promoting at 14:52:31.980 is the part people do not expect. Patroni had already seen that the cluster was unlocked, but it does not act in the middle of a loop pass. It finished the pass it was in, which included checking the other replica’s log position to confirm it was a suitable candidate, and acted on the next one ten seconds later.
The trade-off if you want it faster
The obvious reaction is to cut the timeout to ten seconds. It is worth resisting that, because this is not a performance setting. It is a choice about which kind of failure you would rather have.
A shorter timeout gives faster failover but makes it more likely that a brief network problem, a long garbage collection pause, or an overloaded etcd is mistaken for a dead primary. A false failover is a real outage. Connections drop, transactions in flight are lost, and a node gets promoted that did not need promoting.
A longer timeout gives fewer false alarms and longer real outages.
Patroni requires the timeout to be comfortably larger than the loop interval plus twice the retry timeout. With the values used here, ten and ten, the minimum workable timeout is thirty, which is exactly why thirty was chosen. If you lower the timeout you have to lower the other two as well, or Patroni will reject the configuration.
A reasonably aggressive but still safe set of values on a reliable network is a timeout of 15 with a loop interval and retry timeout of 5. That brings failover to roughly 15 to 20 seconds. Going lower than that needs a genuinely fast and stable network between the nodes and etcd.
These numbers come from one run on one Docker host. Treat them as an illustration of where the time goes, not as a service level you can promise. Measure your own environment.
Post-Failover Verification
Connecting with the same unchanged connection string, and asking the server to identify itself:
SELECT inet_server_addr()  AS server,
       pg_is_in_recovery() AS is_replica,
       current_database()  AS db;
HAProxy was now routing to a different node:
   server   | is_replica
------------+------------
 172.18.0.5 | f
The address changed from the old primary to the new one, and the replica flag is still false, meaning this is a primary. The client connection details did not change at all.
All the data written before the failover was present:
SELECT * FROM ha_test ORDER BY id;Result:
 id |             message              |          created_at
----+----------------------------------+-------------------------------
  1 | record-created-before-failover-1 | 2026-08-29 14:50:16.460916+00
  2 | record-created-before-failover-2 | 2026-08-29 14:50:16.460916+00
  3 | record-created-before-failover-3 | 2026-08-29 14:50:16.460916+00
The counts were confirmed with:
SELECT 'customers' AS tbl, count(*) FROM customers
UNION ALL SELECT 'orders',  count(*) FROM orders
UNION ALL SELECT 'ha_test', count(*) FROM ha_test;
Row counts were unchanged: five customers, seven orders and three marker rows.
Replication at this point shows the cluster running on two nodes:
 pid | application_name | client_addr |   state   | sync_state | sent_lsn  | write_lsn | flush_lsn | replay_lsn
-----+------------------+-------------+-----------+------------+-----------+-----------+-----------+------------
 423 | pg-node-3        | 172.18.0.4  | streaming | async      | 0/4499AB0 | 0/4499AB0 | 0/4499AB0 | 0/4499AB0
(1 row)
Only one replica is listed, because pg-node-2 was still stopped. The new primary is streaming to the one replica it has left, with zero lag. This is the degraded state the cluster runs in after a failover and before the failed node is brought back: still serving reads and writes, but with no spare node to fail over to.
A new row was then inserted through HAProxy to prove the new primary accepts writes:
INSERT INTO ha_test (message) VALUES ('record-created-AFTER-failover');

SELECT * FROM ha_test ORDER BY id;
The message text above is the one that is actually in the captured table. The failover script in the repository appends a timestamp to that string, so running it today produces a slightly different value. This is one of the specific divergences noted earlier between the scripts and this run.
 id |             message              |          created_at
----+----------------------------------+-------------------------------
  1 | record-created-before-failover-1 | 2026-08-29 14:50:16.460916+00
  2 | record-created-before-failover-2 | 2026-08-29 14:50:16.460916+00
  3 | record-created-before-failover-3 | 2026-08-29 14:50:16.460916+00
 34 | record-created-AFTER-failover    | 2026-08-29 14:57:10.552122+00
The write succeeded. The new row has an unexpected identifier, which the next section explains.
Why the Row ID Jumped
The identifier went from 3 to 34. This looks alarming and is not. No rows were lost. The table still holds exactly the three rows from before the failover, plus the new one.
The cause is the way PostgreSQL records sequences in its log. For performance, a sequence does not write a log record every single time it hands out a value. Instead it records a value thirty two increments ahead, then hands out that batch from memory without touching the log again. The constant is named SEQ_LOG_VALS in the PostgreSQL source, and the comment beside it states the consequence plainly: in the event of a crash, as many values as were pre-logged can be skipped over.
So after a crash or a promotion, the sequence carries on from the last value that reached the log, not from the last value actually handed out. The values allocated in memory are abandoned on purpose, because that is what guarantees a restarted server can never hand out an identifier it has already given to somebody else.
The arithmetic lines up exactly. The old primary had recorded ahead to 33, the newly promoted primary carried on from there, and the next value was 34.
The lesson is worth taking away from the failover entirely. PostgreSQL sequences guarantee that values are unique and roughly increasing. They never guarantee that there are no gaps. Any application that treats an auto generated identifier as a gapless counter, for example using it for invoice numbers or reading the highest value to count rows, will eventually be wrong, with or without a failover.
Old Primary Recovery
The old primary container was started again about seven minutes after it was stopped. The first Patroni line in the captured log is at 14:58:58.362 UTC.
What happened is not what most write ups of Patroni would lead you to expect, and it is worth being precise about it. The node rejoined as a replica without pg_rewind running at all.
The way to watch this is the container log, since Patroni narrates what it decides:
docker logs pg-node-2This is the captured log, from test-results/after-recovery/logs-pg-node-2-rejoin.txt:
2026-08-29 14:58:58,362 INFO: Lock owner: pg-node-1; I am pg-node-2
2026-08-29 14:58:58,363 INFO: starting as a secondary
2026-08-29 14:58:58.638 UTC [51] LOG:  redirecting log output to logging collector process
2026-08-29 14:58:58,642 INFO: postmaster pid=51
localhost:5432 - rejecting connections
localhost:5432 - rejecting connections
localhost:5432 - accepting connections
2026-08-29 14:58:59,761 INFO: Lock owner: pg-node-1; I am pg-node-2
2026-08-29 14:58:59,824 INFO: no action. I am (pg-node-2), a secondary, and following a leader (pg-node-1)
Reading that in order: Patroni checked etcd, saw that pg-node-1 held the lock, and decided immediately to start as a secondary. PostgreSQL came up, refused connections for a moment while it completed recovery, then began accepting them. By 14:58:59.824 the node was a replica following the new leader.
The whole rejoin took about 1.5 seconds, from the first Patroni line to following the leader.
Why pg_rewind was not needed
The reason is the way the container was stopped. Stopping a container sends a termination signal first, and Patroni handles that signal by shutting PostgreSQL down cleanly. A clean shutdown means the old primary wrote everything it had accepted and recorded a proper shutdown checkpoint. Its log position did not run ahead of the point where the new primary’s history branched, which the captured log from pg-node-3 records as 0/4489F20 on timeline 1.
With no divergence to undo, there is nothing for pg_rewind to do. PostgreSQL can simply follow the new timeline from where it left off, which is exactly what it did.
Before starting PostgreSQL, Patroni inspected the local data directory. That inspection appears as a block of settings at the top of the same captured log file, and it is the output of the PostgreSQL control data tool, which you can run yourself:
docker exec pg-node-2 pg_controldata /var/lib/postgresql/data/pgdataThree lines in it are the ones that matter for recovery:
  wal_level setting: replica
  wal_log_hints setting: on
  Data page checksum version: 1
Hint logging is on and data checksums are enabled. Those are the two prerequisites for pg_rewind. It was not needed on this occasion, but the cluster was correctly built so that it could have run.
When you would actually see pg_rewind
pg_rewind becomes necessary when the old primary really did diverge, which happens when it accepted a write that the new primary never received and then died without a clean shutdown. Pull the power on the machine, kill the container with an immediate kill rather than a polite stop, or lose the network to a primary that carries on accepting writes for a few seconds, and you get a genuine divergence.
In that case Patroni runs crash recovery on the local data directory, compares timelines, finds the point where the two histories split, and rewinds the data directory back to the last checkpoint both servers still agree on. PostgreSQL then replays forward from the new primary. Any transaction that existed only on the old primary is discarded, because keeping it would mean two conflicting versions of history.
This is the case that makes wal_log_hints worth setting from day one. Without it, and without data checksums, pg_rewind refuses to run and the only way to bring the node back is to copy the whole database again.
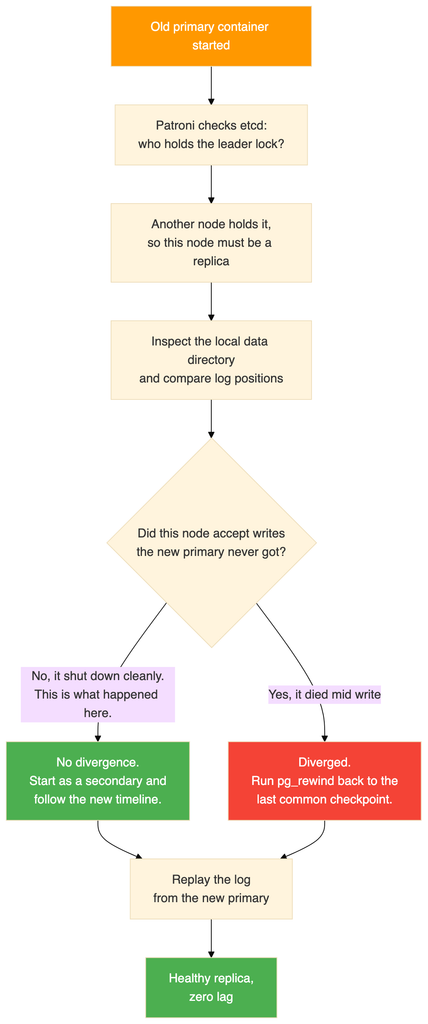
The cluster after recovery
docker exec pg-node-1 patronictl -c /etc/patroni/patroni.yml listResult:
+ Cluster: pg-ha-cluster (7679465736627556386) ----+-----------+
| Member    | Host      | Role    | State     | TL | Lag in MB |
+-----------+-----------+---------+-----------+----+-----------+
| pg-node-1 | pg-node-1 | Leader  | running   |  2 |           |
| pg-node-2 | pg-node-2 | Replica | streaming |  2 |         0 |
| pg-node-3 | pg-node-3 | Replica | streaming |  2 |         0 |
+-----------+-----------+---------+-----------+----+-----------+
All three nodes are healthy, all three are on timeline 2, and both replicas have zero lag. Note that the old primary did not take its role back. Patroni does not fail back automatically, and the node that was promoted stays the leader.
Replication from the new primary, now feeding both replicas again. This is the same pg_stat_replication query as before, ordered by name:
SELECT application_name, client_addr, state, sync_state,
       sent_lsn, write_lsn, flush_lsn, replay_lsn
FROM pg_stat_replication
ORDER BY application_name;
Result:
 pid  | application_name | client_addr |   state   | sync_state | sent_lsn  | write_lsn | flush_lsn | replay_lsn
------+------------------+-------------+-----------+------------+-----------+-----------+-----------+------------
 1210 | pg-node-3        | 172.18.0.4  | streaming | async      | 0/4499E60 | 0/4499E60 | 0/4499E60 | 0/4499E60
 1066 | pg-node-2        | 172.18.0.3  | streaming | async      | 0/4499E60 | 0/4499E60 | 0/4499E60 | 0/4499E60
(2 rows)
Both replicas are at the same log position, so the lag is zero. The process identifiers are new because both connections were established after the failover. The address 172.18.0.3 is the node that used to be the primary, now appearing as a client of the node that replaced it.
Querying the rejoined node directly, connecting to the container rather than through HAProxy, confirmed it holds everything including the row written while it was switched off:
SELECT * FROM ha_test ORDER BY id;Result:
 id |             message              |          created_at
----+----------------------------------+-------------------------------
  1 | record-created-before-failover-1 | 2026-08-29 14:50:16.460916+00
  2 | record-created-before-failover-2 | 2026-08-29 14:50:16.460916+00
  3 | record-created-before-failover-3 | 2026-08-29 14:50:16.460916+00
 34 | record-created-AFTER-failover    | 2026-08-29 14:57:10.552122+00
 35 | record-during-replica-failure    | 2026-08-29 15:00:23.081974+00
(5 rows)
Row 35 needs a word of explanation, because it was written at 15:00:23, which is after this recovery. The after-recovery snapshot in the repository was taken at the very end of the session, once the replica failure test in the next section had also finished. That is why five rows appear here rather than four. Rows 1 to 34 are the state at the moment of the rejoin.
Replica Failure Test
With all three nodes healthy again, a replica was stopped rather than the primary, to confirm that the two cases behave differently.
Node pg-node-3 was stopped. The primary stayed the primary, no election happened, and the application kept working through HAProxy. A write performed during the outage succeeded:
INSERT INTO ha_test (message) VALUES ('record-during-replica-failure');

SELECT * FROM ha_test ORDER BY id;
Result:
 id |             message              |          created_at
----+----------------------------------+-------------------------------
  1 | record-created-before-failover-1 | 2026-08-29 14:50:16.460916+00
  2 | record-created-before-failover-2 | 2026-08-29 14:50:16.460916+00
  3 | record-created-before-failover-3 | 2026-08-29 14:50:16.460916+00
 34 | record-created-AFTER-failover    | 2026-08-29 14:57:10.552122+00
 35 | record-during-replica-failure    | 2026-08-29 15:00:23.081974+00
Then the container was started again and the cluster listed once more:
docker start pg-node-3
docker exec pg-node-1 patronictl -c /etc/patroni/patroni.yml list
It rejoined as a replica within seconds:
+ Cluster: pg-ha-cluster (7679465736627556386) ----+-----------+
| Member    | Host      | Role    | State     | TL | Lag in MB |
+-----------+-----------+---------+-----------+----+-----------+
| pg-node-1 | pg-node-1 | Leader  | running   |  2 |           |
| pg-node-2 | pg-node-2 | Replica | streaming |  2 |         0 |
| pg-node-3 | pg-node-3 | Replica | streaming |  2 |         0 |
+-----------+-----------+---------+-----------+----+-----------+
Note that this recovery needed no pg_rewind either. A replica never accepts writes of its own, so its history cannot diverge. It simply carried on streaming from where it left off.
So neither recovery in this test required a rewind: the replica because it could not diverge, and the old primary because it was shut down cleanly. That is the normal outcome for planned container stops. A rewind is what you get after an unplanned, abrupt loss of a primary.
Losing a replica is a much smaller event than losing a primary. The primary carries on, the other replica carries on, writes are never interrupted, and HAProxy just takes the missing node out of the read pool and puts it back when it returns.
Final Cluster State
After all three tests the cluster was healthy:
- pg-node-1 is the leader, running on timeline 2.
- pg-node-2 is a replica, streaming on timeline 2, with zero lag.
- pg-node-3 is a replica, streaming on timeline 2, with zero lag.
- etcd is healthy.
- HAProxy routes port 5000 to pg-node-1 and port 5001 to the two replicas.
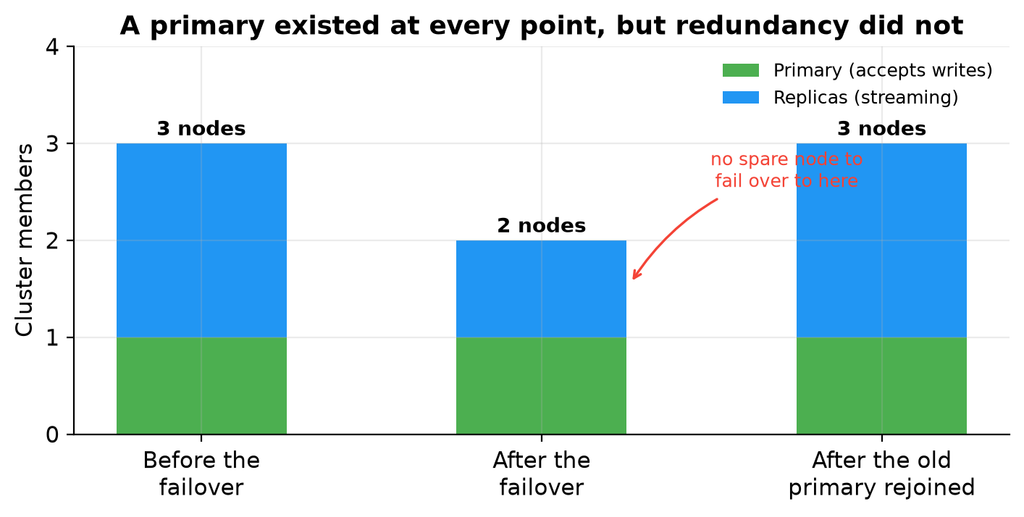
The chart is drawn from the three Patroni cluster listings in the captured evidence. A primary existed at every checkpoint, which is why the application kept working. What disappeared in the middle column is not availability but redundancy: for the seven minutes the old primary stayed down, the cluster was one node away from having nothing to fail over to. That is the window you are trying to keep short in production, and it lasts as long as it takes somebody to bring the failed node back.
The data:
| Table | Rows |
| customers | 5 |
| orders | 7 |
| ha_test | 5 |
The marker table holds five rows: three from before the failover, one written after the failover, and one written while a replica was down. Every row is present and consistent on all three nodes.
Connection Path Explained
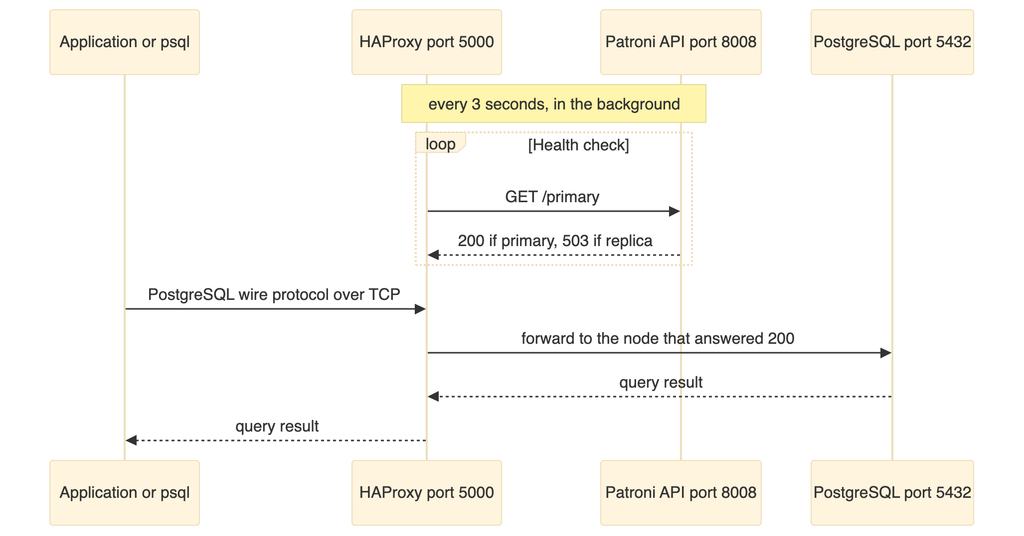
The application connects to HAProxy. The application does not connect to Patroni. The Patroni API exists for HAProxy to health check, and nothing else. The application never needs to know which node is the primary.
When the primary changes, the next health check finds out, and new connections go to the new primary.
Failover Internals
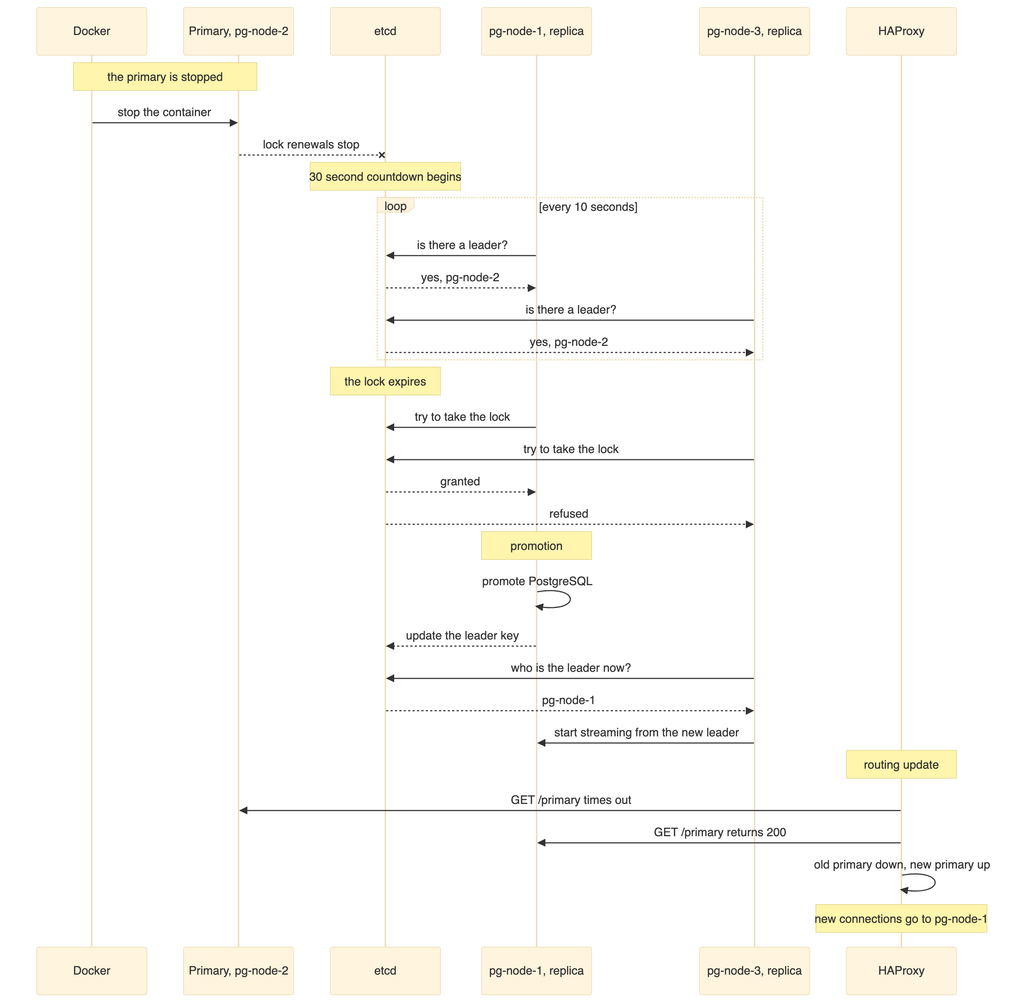
The sequence of events
The same thing as a state machine
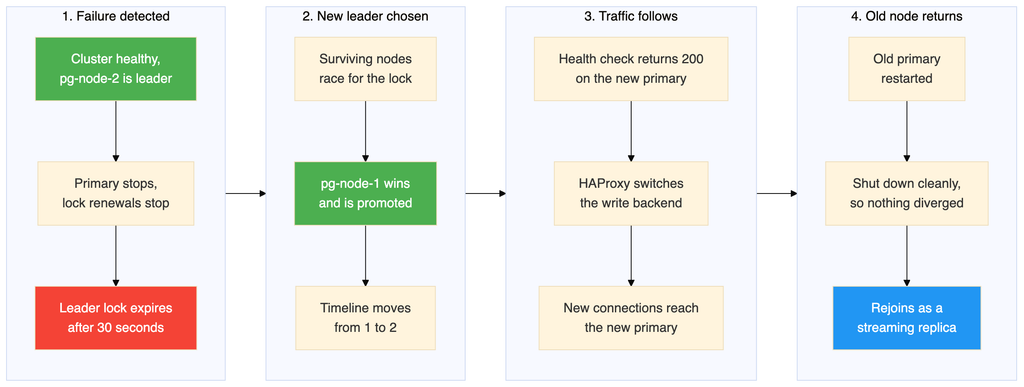
Walking through what happened, step by step:
- The primary fails. The PostgreSQL process stops, or the container stops, or the network becomes unreachable.
- The failure becomes visible. On the failed node itself, Patroni can no longer talk to PostgreSQL. What matters to the other nodes, though, is simply that the leader lock in etcd has stopped being renewed.
- The lock expires. With a thirty second timeout and a ten second loop, the lock survives up to three missed renewals before etcd drops it. In this test the key expired around thirty seconds after the primary was stopped. The surviving nodes then noticed on their next pass and the winner held the lock three seconds later. Those extra seconds are the loop interval, not the timeout, because Patroni only acts when its loop next wakes up.
- The election happens. The surviving nodes try to create the leader key. Only one can succeed, because etcd makes that operation atomic. The winner becomes the leader.
- The winner is promoted. Patroni promotes the local PostgreSQL from read only standby to read write primary. PostgreSQL increases the timeline, in this case from 1 to 2.
- The loser follows. The node that lost sees the new leader in etcd and starts streaming from it instead.
- HAProxy catches up. Its health check finds that the old primary no longer answers and the new one does, so it moves the traffic.
- New connections work. Clients connecting to port 5000 reach the new primary. The connection string never changed.
- The old primary comes back later. Patroni sees that somebody else holds the lock, rewinds the diverged data directory, and rejoins as a replica.
Existing Connections During Failover
This is the part that catches people out, so it is worth stating bluntly. HAProxy does not move existing connections to the new primary.
When the primary fails:
- Any connection that was already open to the old primary is broken. The client sees an error or a timeout.
- HAProxy closes those broken sessions promptly rather than letting them hang, because of the option that shuts down sessions on a server marked down.
- New connections made after HAProxy has noticed the new primary are routed correctly.
- Transactions that were in progress are lost. They are not replayed. The application has to notice the error and retry.
So applications need connection retry with a backoff, transaction retry so a failed transaction is run again on a new connection, and a connection pool that health checks and discards stale connections.
HAProxy gives you a stable address. It does not give you unbroken sessions. High availability at the infrastructure layer is necessary but not sufficient, and the application has to play its part.
Problems Hit While Building This
These are the failures that actually happened during this build, not a general list of things that might go wrong.
The etcd version 2 API returned 404
Patroni logged a failure to get the list of machines from the etcd version 2 endpoint, with a response of 404 page not found.
The cause is that etcd 3.5 has the older version 2 API disabled by default, while the plain Patroni etcd package uses that version 2 client.
The fix has two parts. Install the Patroni variant that speaks the version 3 API, and configure the version 3 section in the Patroni configuration rather than the version 2 section. After the fix, Patroni logs that it has selected an etcd server, with no version 2 errors.
The initialisation step refused to run as root
Creating the data directory failed with an error saying it cannot be run as root, and a hint suggesting logging in as the unprivileged user that will own the server process.
The cause is that the custom image ran as root, and PostgreSQL refuses to create a data directory as root for safety.
The fix is to switch the image to the postgres user, and to make sure the directory holding the Patroni configuration is owned by that user so it remains writable.
The environment variable quietly overrode the configuration file
Even with the version 3 section present in the configuration file, Patroni still used the version 2 protocol.
The cause is that Patroni reads environment variables whose names map onto configuration sections, and those variables win over the file. A variable naming the version 2 hosts therefore selected the version 2 client no matter what the file said.
The fix is to name the environment variable so that it maps to the version 3 section instead.
This one is worth remembering as a general point. With Patroni, an environment variable will silently beat the configuration file, so if a setting appears to be ignored, check the environment before doubting the file.
Log messages that look like problems and are not
The captured logs contain three recurring messages that will worry you the first time and can be ignored in this environment.
A watchdog device warning during promotion. At the exact moment of promotion, Patroni logged that it could not activate a Linux watchdog device, because /dev/watchdog does not exist. Patroni can use a hardware watchdog as a last line of defence, so that a node which loses its lock but somehow fails to demote itself gets forcibly rebooted. Containers have no watchdog device, so the feature is unavailable. The promotion went ahead normally. In production on real hardware this is worth configuring, because it closes a genuine gap.
A watchprefix protocol error against etcd. Every node logged a broken connection error mentioning an invalid chunk length, at startup and again during the failover. This is Patroni’s long lived watch on etcd being cut and re established, which is normal behaviour when the key being watched changes or the connection is recycled. The cluster carried on working through every one of these.
Connection reset tracebacks from the Patroni API. Several nodes logged full Python tracebacks ending in a connection reset by peer, for requests coming from the HAProxy container address. This is HAProxy closing a health check connection as soon as it has the status code it needs, before Patroni has finished writing the response body. It is noisy and harmless. If it bothers you, the volume drops if you lengthen the health check interval.
None of these three affected the outcome, and all three appear in a cluster that is working correctly. The reason to know about them is so you do not go looking for a fault that is not there.
Validation Checklist
Every item below was confirmed during the run.
| Check | Result |
| Compose configuration valid | Passed |
| All containers start | Passed |
| etcd healthy | Passed |
| Patroni healthy on all nodes | Passed |
| One primary exists | Passed |
| Two replicas exist | Passed |
| Streaming replication working with zero lag | Passed |
| Application database and sample data present | Passed |
| Client connects through the HAProxy write port | Passed |
| Primary failure tested by stopping the container | Passed |
| New primary elected without intervention | Passed, pg-node-1 after about 34 seconds |
| New primary accepts writes | Passed |
| Data written before the failover survives | Passed |
| HAProxy routes to the new primary | Passed. Order and reason codes confirmed in the log, though that log has no timestamps |
| Old primary rejoins the cluster | Passed, in about 1.5 seconds, without needing pg_rewind |
| Three node cluster restored on timeline 2 | Passed |
| Replica failure tested separately | Passed, no failover and no interruption to writes |
| All figures in this document taken from captured output | Passed |
Few things worth taking away
Each component solves exactly one problem. PostgreSQL replicates, etcd arbitrates, Patroni decides and acts, HAProxy routes. No component covers for another, and when something breaks that split tells you where to look first.
Failover time is a policy decision, not a measure of speed. Thirty of the thirty three seconds were the cluster deliberately waiting out a timeout to be sure the primary was really gone. The promotion took under a second. You can make it faster, but you pay for that speed with a greater risk of failing over when nothing was actually wrong.
A stable address is not an unbroken session. The connection string never changed, and every open connection still died. Applications need retry logic.
How the primary dies changes how it comes back. The rejoin here took 1.5 seconds and needed no pg_rewind, because stopping the container let Patroni shut PostgreSQL down cleanly. An abrupt loss would have diverged the node and forced a rewind. Hint logging and data checksums were enabled at creation time, so that rewind would have been possible. Neither can be added after an incident, and checksums can only be set when the data directory is first created.
A cluster you have not deliberately broken is not a tested cluster. Everything here worked, and that is only known because the primary was actually killed rather than assumed to be survivable.
Being honest about what this protects
This build defends against exactly one thing: the loss of a single PostgreSQL node. It does nothing about the single etcd node, the single host, disk corruption that replicates to every replica, or a mistaken delete that reaches all three nodes in milliseconds.
Replication keeps three copies of your data in step, including the copy of an accident. A real backup strategy, with restores that have actually been tested, belongs at the top of the production list.
Reasonable next steps
- Turn on synchronous replication and measure what it costs in write latency against what it buys in durability.
- Replace the single etcd node with three, then break the network to one of them.
- Put a connection pooler in front of HAProxy and watch how pooling changes what the application sees during a failover.
- Run a planned switchover with the Patroni command line tool and compare it with the unplanned failover measured here. It is far quicker, because nothing has to wait for a timeout to expire.
Source code
All configuration files and test scripts referred to in this document are in the public repository:
https://github.com/rameshsraj/pgandpatroni
The Patroni build is in the postgres-patroni-ha folder. This document explains what each piece does and what happened when it was tested. It does not reproduce the files themselves, so please read them in the repository if you plan to adapt them.
Leave a Reply